HTTPS response time
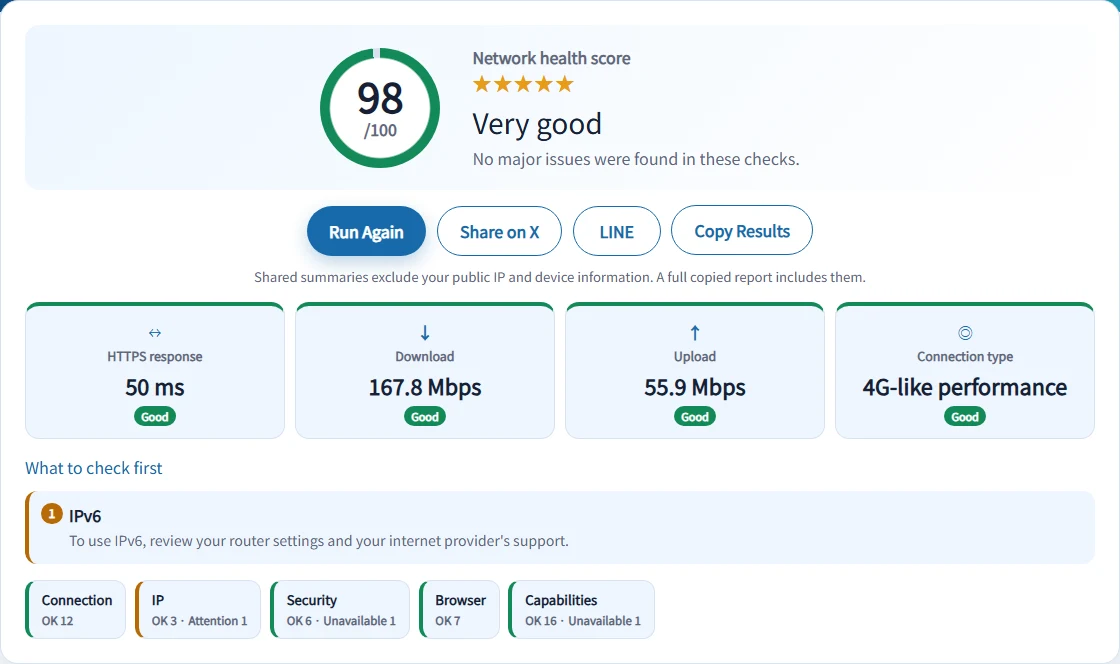
Median of successful requests to this site, including server and browser effects.
When the connection feels slow or unstable
See the connection.
Find your next check.
Check HTTPS response time, jitter, DNS reachability, IPv4/IPv6, and basic transfer speeds. Bring the measurements and practical troubleshooting tips together in one place.
These checks describe what the browser can observe on its current connection to pctrouble.help. They do not certify your hardware, ISP, or every destination on the internet.
Median of successful requests to this site, including server and browser effects.
Response-time standard deviation and HTTP failure rate from eight requests.
Small adaptive transfers of dummy payload data on this route.
Site reachability, page timing, and a separate server-side lookup of fixed public records.
The public IP version observed by this site for the diagnostic request.
Reference information and 17 capability checks, with unsupported items identified.
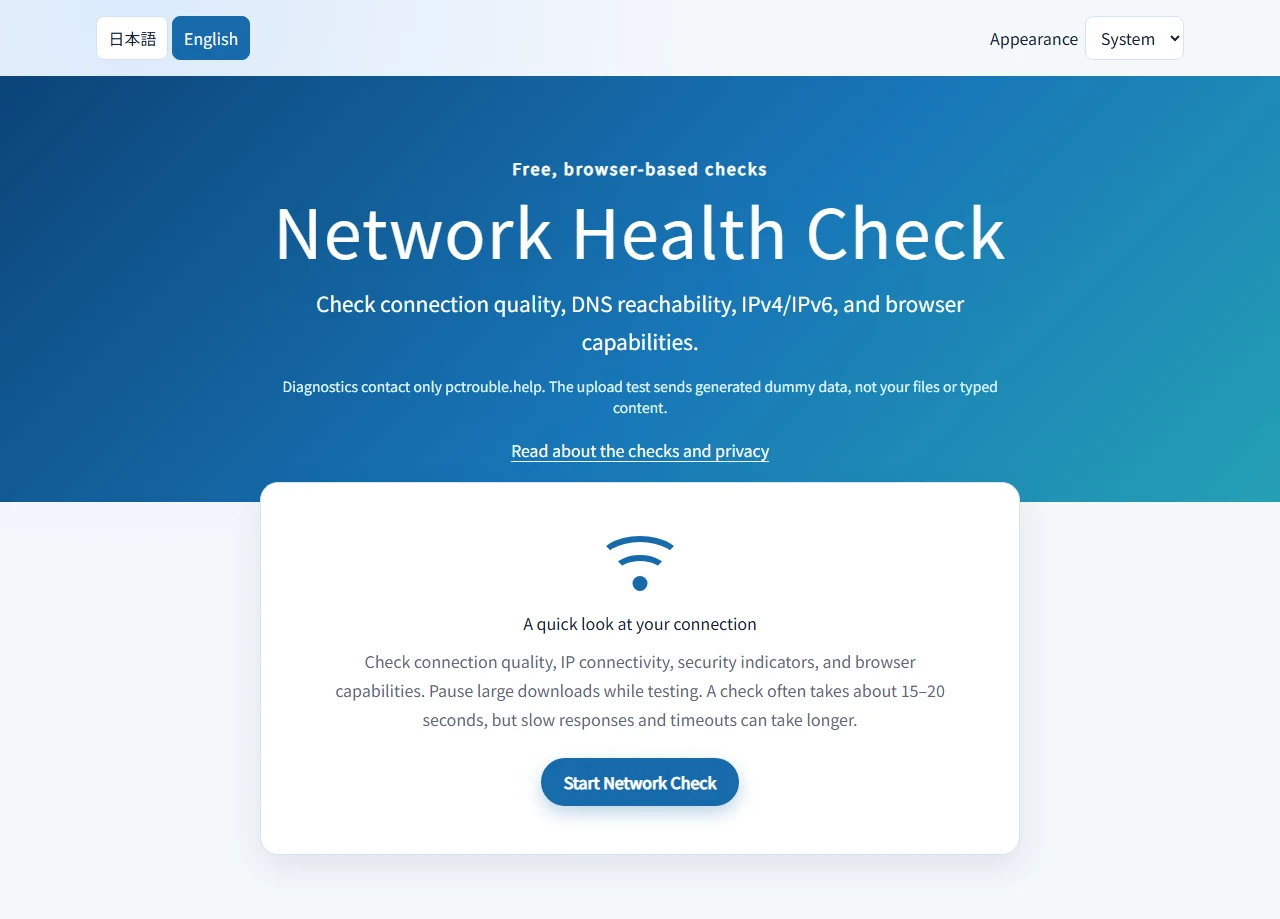
Open the tool in English and select Start Network Check. Pause large transfers on this and other devices. No measurement starts just by opening the guide or app.
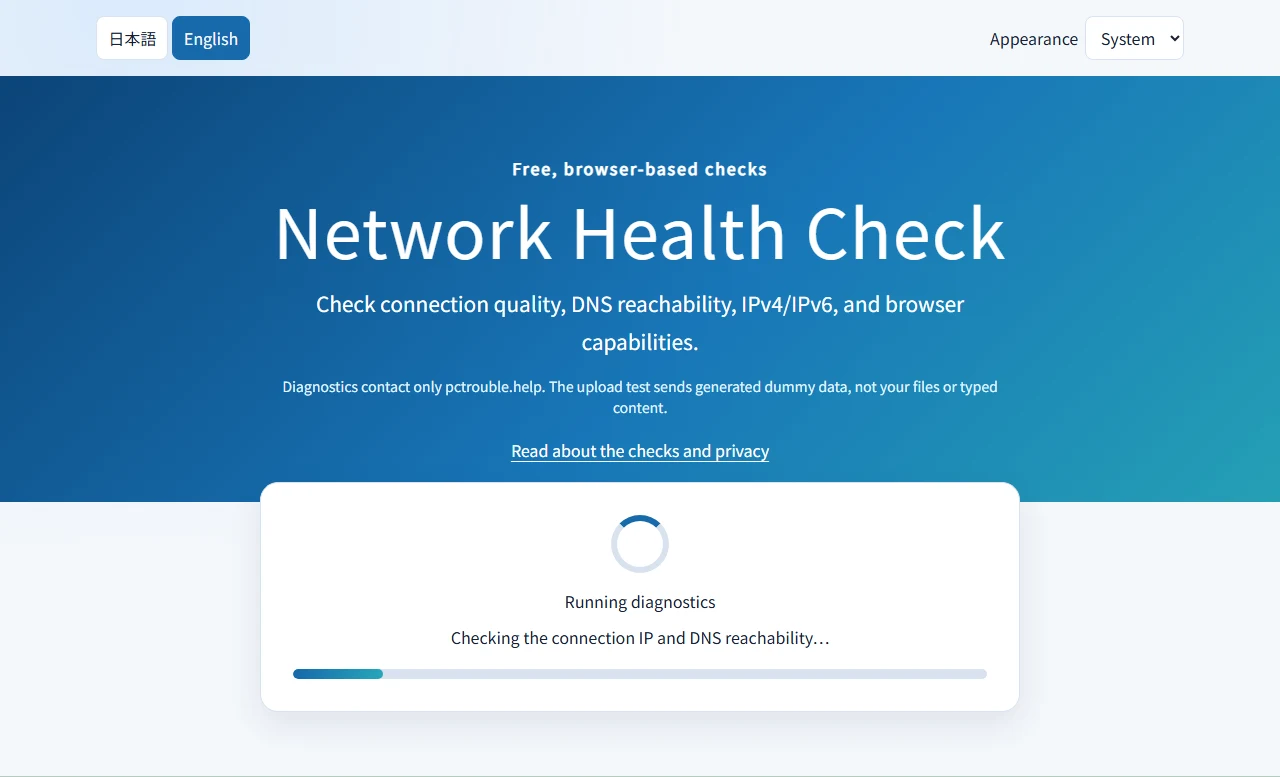
The browser checks this connection to pctrouble.help, then security indicators and browser capabilities. A run often takes about 15–20 seconds; slow responses and timeouts can take longer.
Compare the score, measured values, unavailable items, and troubleshooting tips. Copy the full report locally or share a summary that excludes your public IP and device information.
The 100-point score summarizes the existing checks. Open each category to see detected issues and unavailable information. Browser capability support and internet connection quality are different things.
Connecting to the site may use cached DNS. Page DNS timing is separate from the server-side public-record lookup. The tool does not read your operating-system resolver settings. IPv4/IPv6 results describe the request seen by this site.
The ping-like result is HTTPS response time. Jitter is the standard deviation of successful samples, and the failure percentage counts HTTP requests. Basic speeds are estimates for this server, not maximum line-speed measurements.
HTTPS, secure context, loaded resources, cookies, Do Not Track, and local WebRTC candidates provide limited observations. An encrypted connection is not a guarantee that your whole environment is safe. VPN use cannot be determined automatically.
Diagnostics use the existing pctrouble.help endpoints. The transfer tests use generated dummy data, at most 5 MiB down and 1.25 MiB up per run, plus request and protocol overhead. Your personal files and typed content are not uploaded.
The public IP is returned for display and is not saved by the diagnostic feature. Normal server access logs may still exist under the site's operating policy. A full copied report includes the displayed public IP and device information; review it before sending it elsewhere. Built-in shared summaries exclude those details.
You choose when to start. Changing languages preserves the run and completed results without adding measurements. Leaving the page cancels the run; it is not a background monitoring service.
Pause downloads, cloud sync, and other large transfers. Move closer to your Wi-Fi router, compare a supported 5 GHz band, or try Ethernet. Repeat only when you need to compare a change.
Compare another browser and review content-blocking or privacy settings. If other sites also fail, check router power, cables, and your provider's service-status information. A failed endpoint is not proof that the whole network is down.
Compare the observed route with your VPN app and settings. Time zone and WebRTC results are reference information, not a reliable VPN detector. Ask your provider about IPv6 if you want to enable it.
Checking a different part of your computer? Browse the other English tools and their guides.
It is a set of browser-based checks of your connection to pctrouble.help, including HTTPS response time, basic speeds, DNS reachability, the observed IP route, and browser capabilities. It helps you collect clues; it cannot identify every cause of a network problem.
Yes. It is free, with no sign-up or installation. The checks use your internet connection and transfer generated dummy data, so normal data charges can apply.
The score starts at 100 and subtracts the existing penalties for observed issues. It is a reference for these checks, not a certification of your whole network. Unsupported browser features generally have no penalty. Some settings and unconfirmed checks can affect the score; review the individual results.
No. It times eight HTTPS requests to pctrouble.help and shows the median successful response time. Browser overhead and server processing can affect it. It is not a ping to your router, ISP equipment, or a game server.
It is the standard deviation of the successful HTTPS response-time samples. It describes variation in this small set of HTTP requests, rather than an ICMP or real-time media jitter measurement.
It reports the percentage of eight HTTP requests that fail or time out. This is an HTTP request failure rate, not direct measurement of lost network packets. Browser blocking, server availability, and timeouts can affect it.
You can see the IP version used for the diagnostic request that reached this site. An IPv4 result does not prove that your internet connection lacks IPv6. An IPv6 result confirms this observed route, not every possible IPv6 destination.
No reliable yes-or-no VPN detection is provided. The tool collects reference information such as the public IP, time zone, and local WebRTC exposure result. Compare it with your VPN app and settings. WebRTC checks use no added external STUN service.
This small HTTPS transfer measures the current route to pctrouble.help. Server load, distance, Wi-Fi conditions, other traffic, browser timing, and a VPN can affect the estimate. It is not your ISP plan limit or a guarantee of performance to other services.
Browsers expose different APIs and may restrict them for privacy, permissions, or security. Network Information API estimates, GPU details, and some storage or execution features may be unavailable. This alone does not mean your connection is faulty.
No. Upload measurements send byte arrays generated in your browser to the existing same-origin endpoint. The endpoint counts the bytes and discards the payload without saving it. Your files and typed content are not used.
The adaptive transfer tests use at most 5 MiB of download payload and 1.25 MiB of upload payload per run. Other diagnostic requests, protocol overhead, and interrupted transfers may add traffic. Switching languages does not rerun the checks or add measurements.
Yes, the interface adapts to phones and tablets as well as computers. Available results depend on the browser and its privacy settings. A cellular connection still uses data, and results can change with reception or background traffic.
It combines basic transfer estimates with connection, DNS, IP-route, security, and browser-capability checks. It does not choose nearby measurement servers, saturate your connection, or promise to measure your maximum line speed.
No. It cannot inspect your router, read your operating-system DNS configuration, prove Wi-Fi signal quality, or diagnose every ISP or application issue. Use the results to compare conditions and decide what to check next.
Run one check, compare the results, and decide what to investigate next.
Open Network Health Check